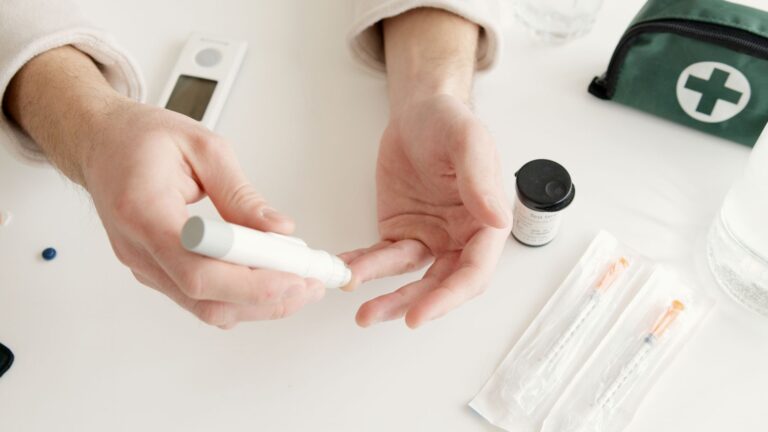
Track insulin resistance — when cells respond weakly to insulin — by repeating the same fasting glucose-plus-insulin pair for HOMA-IR and logging A1C with each check. Review the trend with your clinician and link it to action on activity, blood pressure, weight, and cholesterol in a dementia-prevention plan.
Family history raises concern but does not set destiny. The Alzheimer's Association identifies APOE-e4 as the first-identified and strongest risk gene for late-onset Alzheimer's, raising likelihood and sometimes bringing earlier onset without guaranteeing disease. The Lancet's 2024 commission estimated about 45% of dementia cases are potentially preventable by addressing 14 modifiable factors including diabetes, hypertension, obesity, inactivity, and high LDL cholesterol, according to the Lancet commission on dementia prevention.
Medical information disclaimer: This article is for general educational purposes only and does not provide medical advice, diagnosis, or treatment. Always consult a physician or other qualified health professional about symptoms, medications, tests, or treatment decisions.
Table of Contents
- Which labs track insulin resistance?
- What do the numbers mean?
- Why does this matter for dementia risk?
- What does family history change?
- How do you act on the trend?
Which labs track insulin resistance?
Ask your clinician for paired fasting glucose and fasting insulin drawn together after an overnight fast. Calculate HOMA-IR as fasting insulin in µU/mL times fasting glucose in mg/dL divided by about 405. Boston Heart Diagnostics explains its test uses 401.85 as the divisor and requires fasting, as described in the Boston Heart test description.
Get A1C at the same visit and record fasting glucose beside it. NIDDK classifies prediabetes at A1C 5.7-6.4% and fasting plasma glucose 100-125 mg/dL, a range that can reveal risk when one value looks normal, according to the NIDDK guide to prediabetes and insulin resistance. Use a simple repeatable routine:.
- use the same lab and same fasting protocol each time
- draw glucose and insulin together, plus A1C
- log date, medications, illness, sleep, and weight
- repeat on the schedule your clinician sets, then compare trends
What do the numbers mean?
Boston Heart Diagnostics rates HOMA-IR below 2.0 as optimal, 2.0-3.0 as borderline, and above 3.0 as increased risk. Treat the bands as signals, not diagnoses. A value of 1.4 differs in meaning from 2.6 or 3.8, but a single borderline result matters less than direction over time. Read A1C and fasting glucose with HOMA-IR.
A1C reflects average glucose over two to three months, while fasting glucose shows that morning only. Normal fasting glucose with rising insulin and HOMA-IR can flag strain earlier than glucose alone. Ask your clinician what change would trigger action for you. People differ by medicines, age, kidney and liver health, and pregnancy. Set a personal review threshold before you test again.
Why does this matter for dementia risk?
A 10-study prospective-cohort meta-analysis linked insulin resistance to higher dementia risk, with hazard ratios of 1.11 for all-cause dementia, 1.23 for Alzheimer's disease, and 1.04 for vascular dementia, as reported in the BMC Neurology meta-analysis. The link was strongest for Alzheimer's in that analysis. Risk ratios describe groups, not your future. Prevention targets the cluster around insulin resistance.
High blood sugar, hypertension, excess weight, inactivity, and high LDL cholesterol each injure vessels and brain tissue over years. Improving several together offers more leverage than chasing glucose alone. That is why dementia plans pair metabolic tracking with blood-pressure control, lipid checks, exercise, sleep, and cognitive and social activity. Your HOMA-IR trend becomes one gauge among several, not a brain test.
What does family history change?
Family history increases attention, not urgency for self-treatment. If you know your APOE-e4 status, share it with your clinician because it shapes risk discussion and screening choices. If you do not know it, you can still act on the modifiable factors. Evidence supports action across genotypes.
In the two-year U.S. POINTER trial reported July 28, 2025, both structured and self-guided multidomain lifestyle programs improved cognition in at-risk older adults, with larger gains in the structured group and benefits across APOE-e4 genotypes, according to the Alzheimer's Association and AAIC. Structure meant coaching, exercise and diet support, and vascular-risk monitoring. Do not use a direct-to-consumer gene result to change diabetes or cholesterol drugs on your own. Use it to prompt earlier review of A1C, blood pressure, lipids, diet quality, physical activity, hearing loss, depression, and smoking.
How do you act on the trend?
Start with the trend, not one number. If HOMA-IR climbs from optimal toward borderline while A1C moves from 5.5% toward 5.9%, ask about food pattern, daily steps, strength sessions, sleep hours, alcohol, and medicines that raise glucose. If readings fall after changes, keep the routine that produced the drop. Keep prevention concrete between visits.
Walk most days, build muscle twice weekly, favor fiber-rich foods and unsaturated fats, limit sugary drinks and refined starches, and treat blood pressure and LDL to your clinician's targets. People with prediabetes-range labs may qualify for a CDC-recognized lifestyle-change program. HOMA-IR is a calculated proxy with population-dependent cutoffs, so repeat the same-lab fasting pair plus A1C and have a clinician read the pattern. Bring every prior result to each visit so diet, activity, or medication changes follow the trend rather than one reading.